Plot Estimate from 'htest' Object
plot_htest_est.Rd![[Stable]](figures/lifecycle-stable.svg)
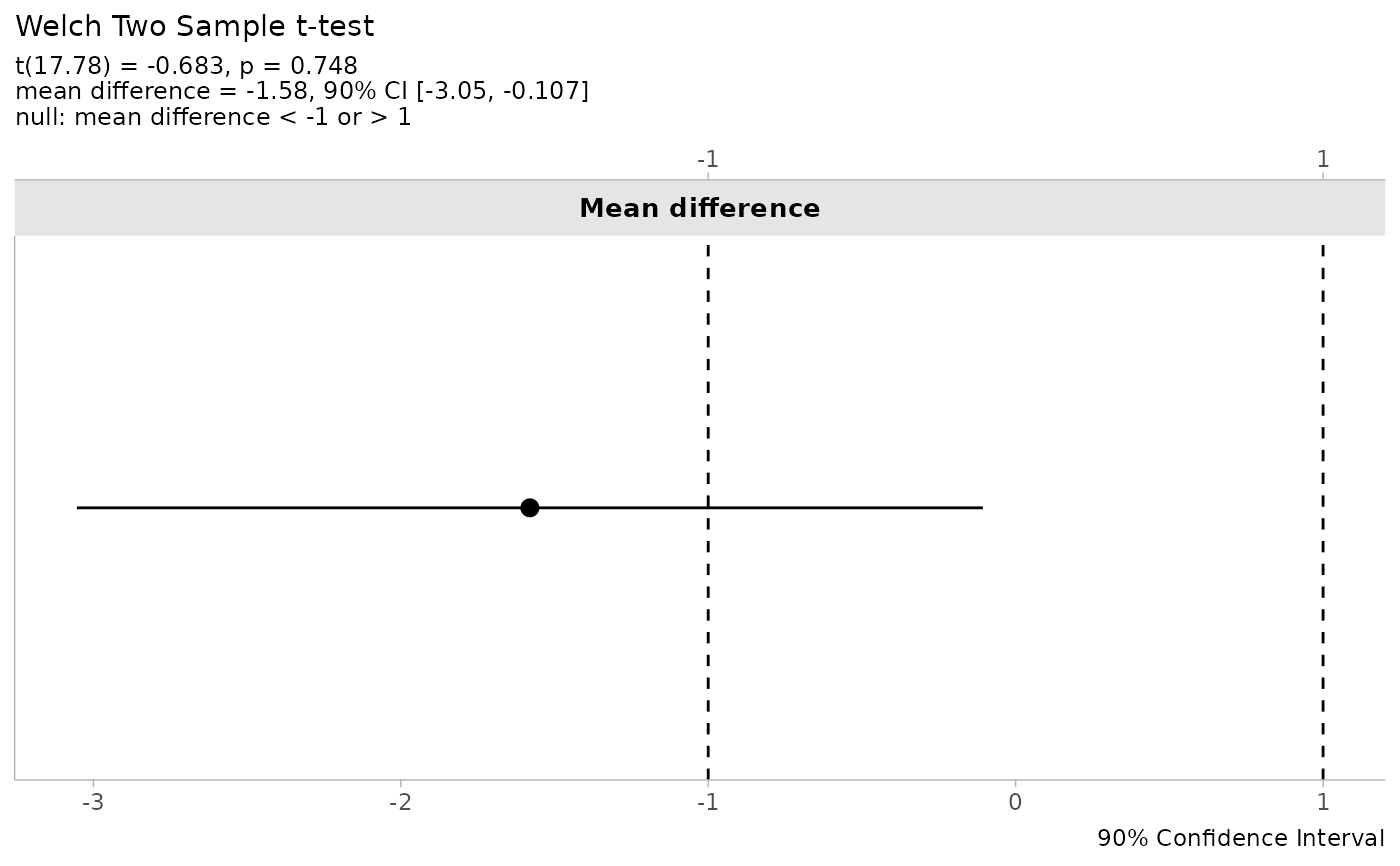
Creates a simple point estimate plot with confidence interval from any 'htest' object that contains an estimate and confidence interval. This provides a visual representation of the effect size and its uncertainty, similar to a forest plot.
Arguments
- htest
An S3 object of class 'htest' containing at minimum an
estimateandconf.intcomponent. Examples include output fromt.test(),cor.test(), or TOSTER functions converted withas_htest().- alpha
Significance level for determining the confidence level label.
- describe
Logical. If TRUE (default), includes a concise statistical description in the plot subtitle showing the test statistic, p-value, estimate, confidence interval, and the null hypothesis.
Details
The function creates a horizontal point-range plot showing:
Point estimate (black dot)
Confidence interval (horizontal line)
Null value(s) as dashed vertical reference line(s)
For two-sample t-tests, R's t.test() returns both group means as the estimate
rather than their difference. This function automatically computes the difference to display
a single meaningful estimate with its confidence interval.
If the 'htest' object contains equivalence bounds (two values in null.value),
both bounds are displayed as dashed vertical lines.
When describe = TRUE, the plot includes a three-line subtitle:
Test statistic and p-value
Point estimate and confidence interval
Null hypothesis statement
The method name appears as the plot title.
See also
Other htest:
as_htest(),
htest-helpers,
simple_htest()
Examples
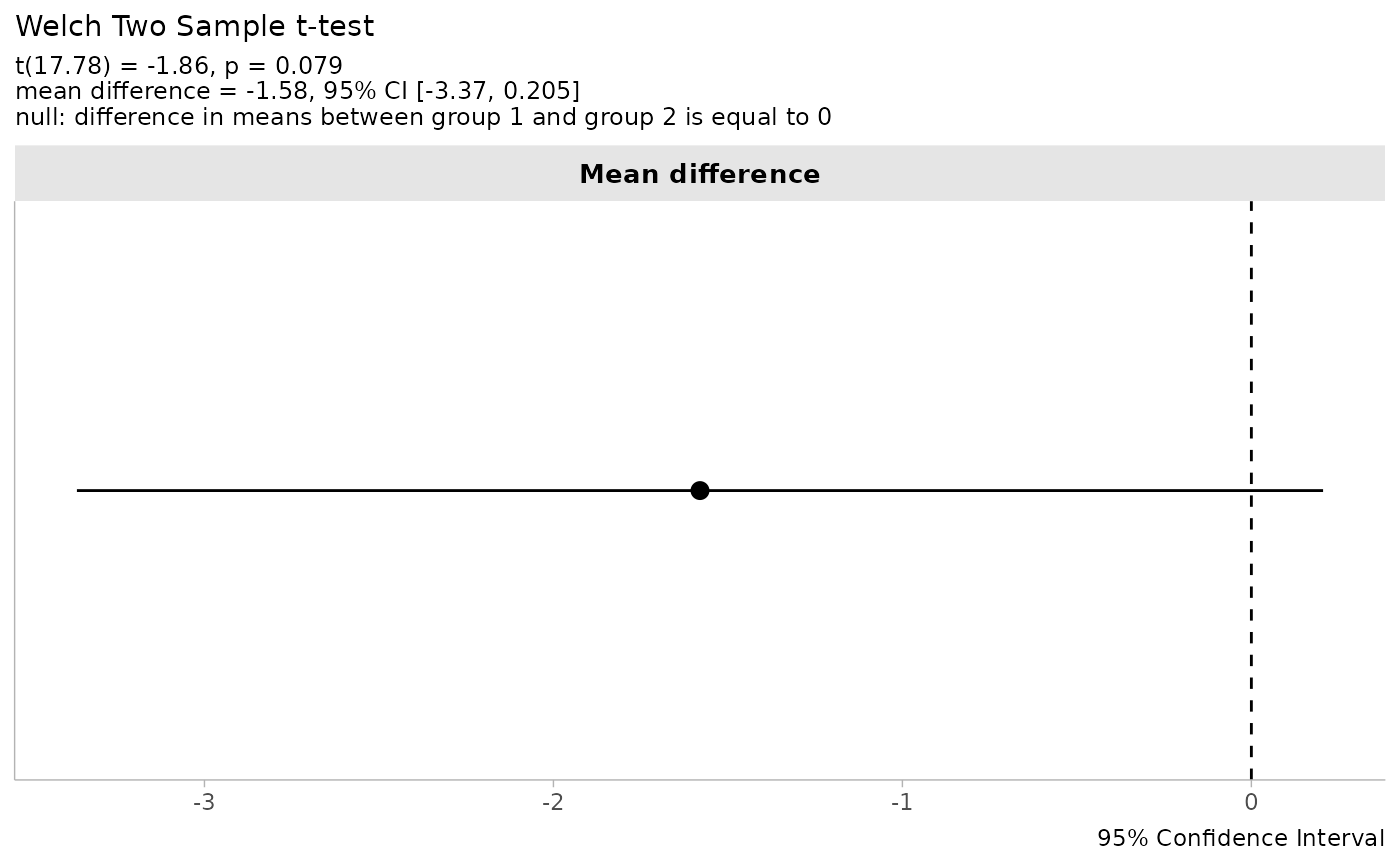
# Standard t-test
t_result <- t.test(extra ~ group, data = sleep)
plot_htest_est(t_result)
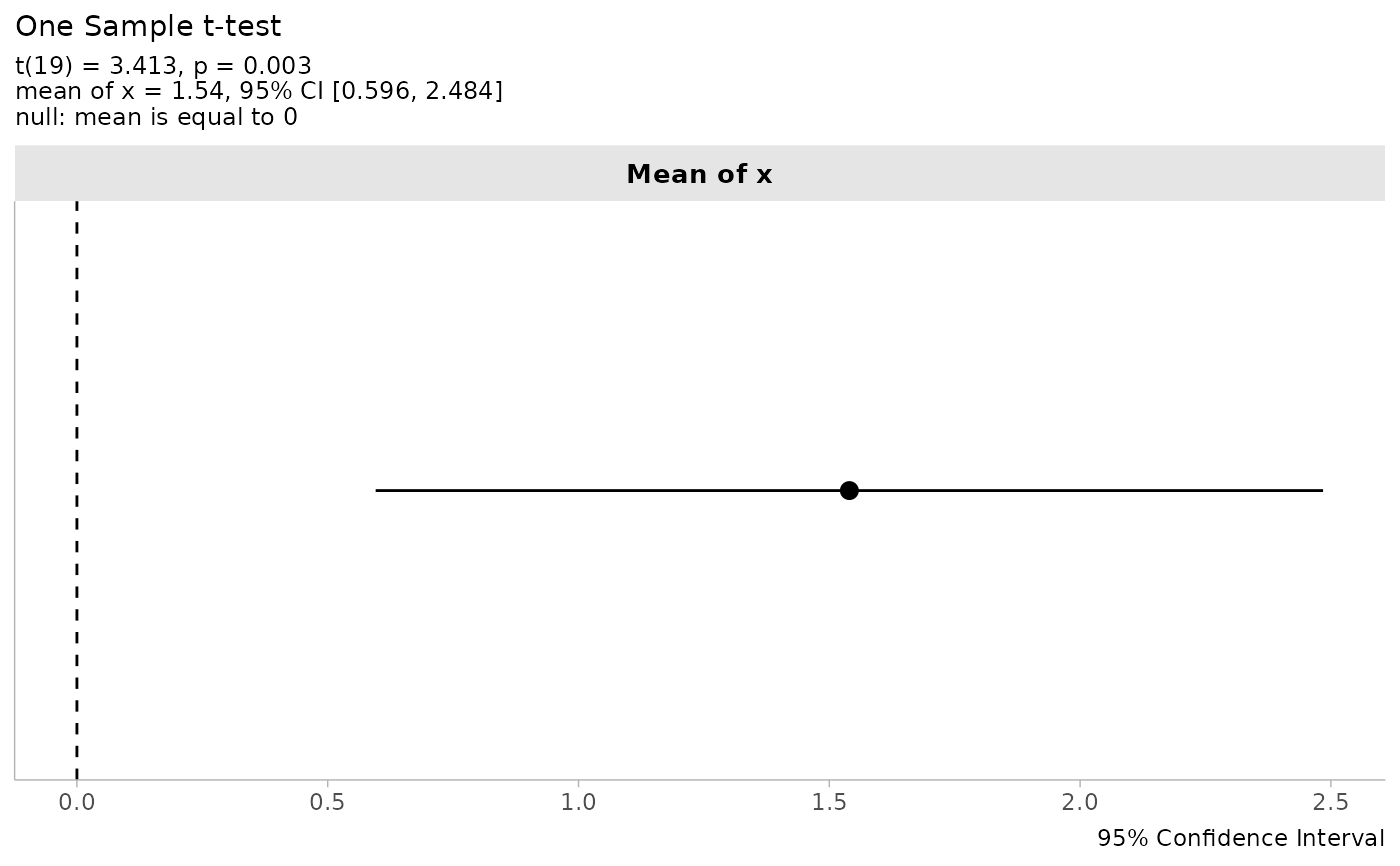
 # One-sample t-test
t_one <- t.test(sleep$extra, mu = 0)
plot_htest_est(t_one)
# One-sample t-test
t_one <- t.test(sleep$extra, mu = 0)
plot_htest_est(t_one)
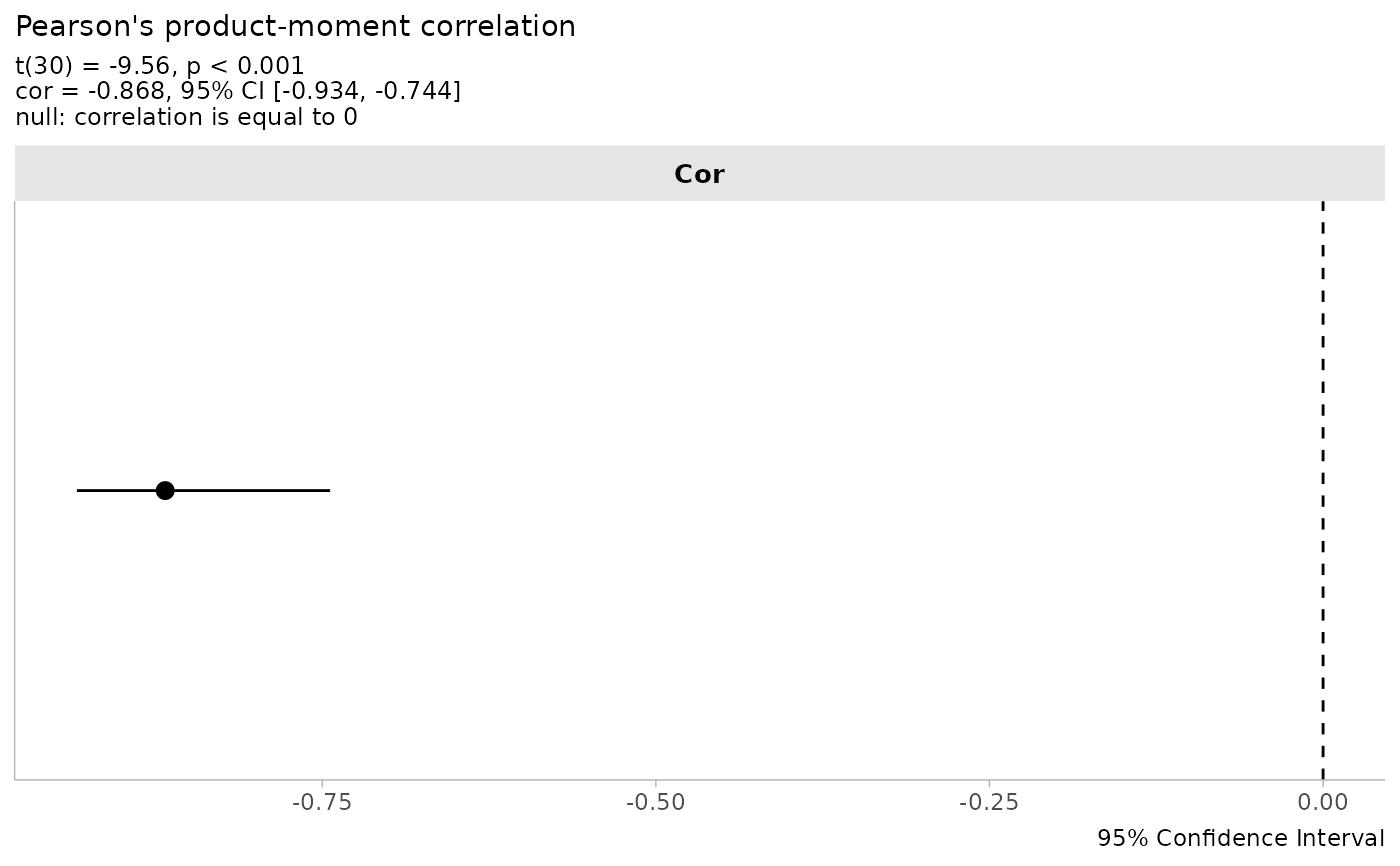
 # Correlation test
cor_result <- cor.test(mtcars$mpg, mtcars$wt)
plot_htest_est(cor_result)
# Correlation test
cor_result <- cor.test(mtcars$mpg, mtcars$wt)
plot_htest_est(cor_result)
 # TOST result converted to htest
tost_res <- t_TOST(extra ~ group, data = sleep, eqb = 1)
plot_htest_est(as_htest(tost_res))
# TOST result converted to htest
tost_res <- t_TOST(extra ~ group, data = sleep, eqb = 1)
plot_htest_est(as_htest(tost_res))
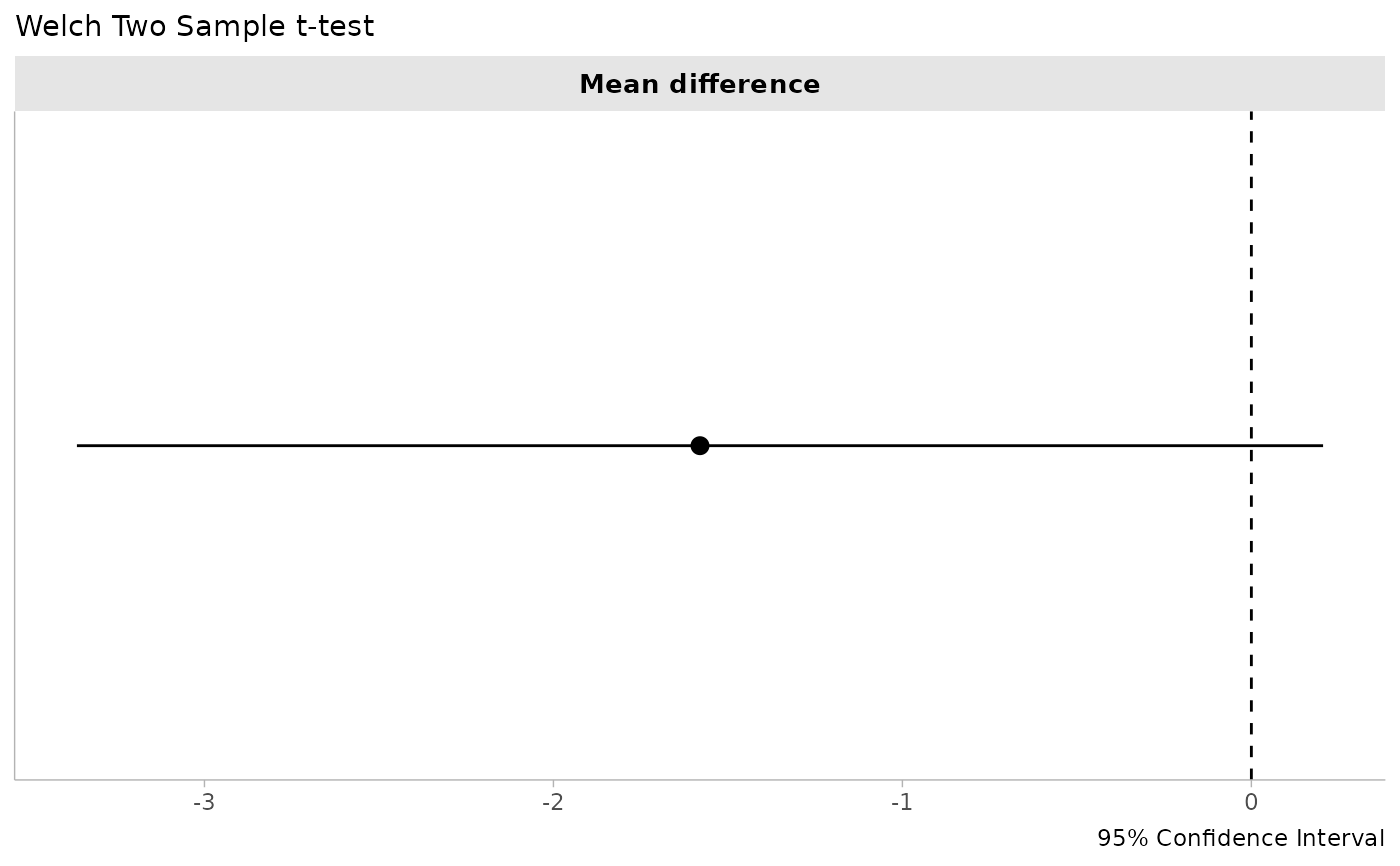
 # Without description
plot_htest_est(t_result, describe = FALSE)
# Without description
plot_htest_est(t_result, describe = FALSE)