TOST Independent Samples T-Test
dataTOSTtwo.RdTOST Independent Samples T-Test for jamovi. This function is not meant to be utilized in R. See t_TOST function.
Usage
dataTOSTtwo(
  data,
  deps,
  group,
  var_equal = FALSE,
  hypothesis = "EQU",
  low_eqbound = -0.5,
  high_eqbound = 0.5,
  eqbound_type = "raw",
  alpha = 0.05,
  desc = FALSE,
  plots = FALSE,
  descplots = FALSE,
  low_eqbound_d = -999999999,
  high_eqbound_d = -999999999,
  smd_type = "g"
)
Arguments
- data
the data as a data frame
- deps
a vector of strings naming dependent variables in
data- group
a string naming the grouping variable in
data; must have two levels- var_equal
TRUEorFALSE(default), assume equal variances- hypothesis
'EQU'for equivalence (default), or'MET'for minimal effects test, the alternative hypothesis.- low_eqbound
a number (default: -0.5) the lower equivalence/MET bounds
- high_eqbound
a number (default: 0.5) the upper equivalence/MET bounds
- eqbound_type
'SMD'(default) or'raw'; whether the bounds are specified in Cohen's d or raw units respectively- alpha
alpha level (default = 0.05)
- desc
TRUEorFALSE(default), provide descriptive statistics- plots
TRUEorFALSE(default), provide effect size plots- descplots
TRUEorFALSE(default), provide plots- low_eqbound_d
deprecated
- high_eqbound_d
deprecated
- smd_type
'd'(default) or'g'; whether the calculated effect size is biased (d) or bias-corrected (g).
Value
A results object containing:
results$text | a html | ||||
results$tost | a table | ||||
results$eqb | a table | ||||
results$effsize | a table | ||||
results$desc | a table | ||||
results$plots | an array of images | ||||
results$descplots | an array of images |
Tables can be converted to data frames with asDF or as.data.frame. For example:
results$tost$asDF
as.data.frame(results$tost)
References
Berger, R. L., & Hsu, J. C. (1996). Bioequivalence Trials, Intersection-Union Tests and Equivalence Confidence Sets. Statistical Science, 11(4), 283-302.
Gruman, J. A., Cribbie, R. A., & Arpin-Cribbie, C. A. (2007). The effects of heteroscedasticity on tests of equivalence. Journal of Modern Applied Statistical Methods, 6(1), 133-140, formula for Welch's t-test on page 135
Examples
library(TOSTER)
## Load iris dataset, remove one of the three groups so two are left
data<-iris[which(iris$Species!="versicolor"),]
## TOST procedure on the raw data
dataTOSTtwo(data, deps="Sepal.Width", group="Species", var_equal = TRUE, low_eqbound = -0.5,
high_eqbound = 0.5, alpha = 0.05, desc = TRUE, plots = TRUE)
#>
#> TOST INDEPENDENT SAMPLES T-TEST
#>
#> Hypothesis Tested: Equivalence
#>
#> Null Hypothesis: -0.5 ≥ (Mean1 - Mean2) or (Mean1 - Mean2) ≥ 0.5
#> Alternative: -0.5 < (Mean1 - Mean2) < 0.5
#> ✅ NHST: reject null significance hypothesis that the effect is
#> equal to zero
#> ❌ TOST: don't reject null equivalence hypothesis
#>
#> Note: SMD confidence intervals are an approximation. See our <a
#> href="https://aaroncaldwell.us/TOSTERpkg/articles/SMD_calcs.html">documentation.
#>
#> TOST Results
#> ─────────────────────────────────────────────────────────────────────
#> t df p
#> ─────────────────────────────────────────────────────────────────────
#> Sepal.Width t-test 6.450349 98.00000 < .0000001
#> TOST Lower 13.55426 98.00000 < .0000001
#> TOST Upper -0.6535596 98.00000 0.2574631
#> ─────────────────────────────────────────────────────────────────────
#>
#>
#> Equivalence Bounds
#> ────────────────────────────────────────────────────────
#> Low High
#> ────────────────────────────────────────────────────────
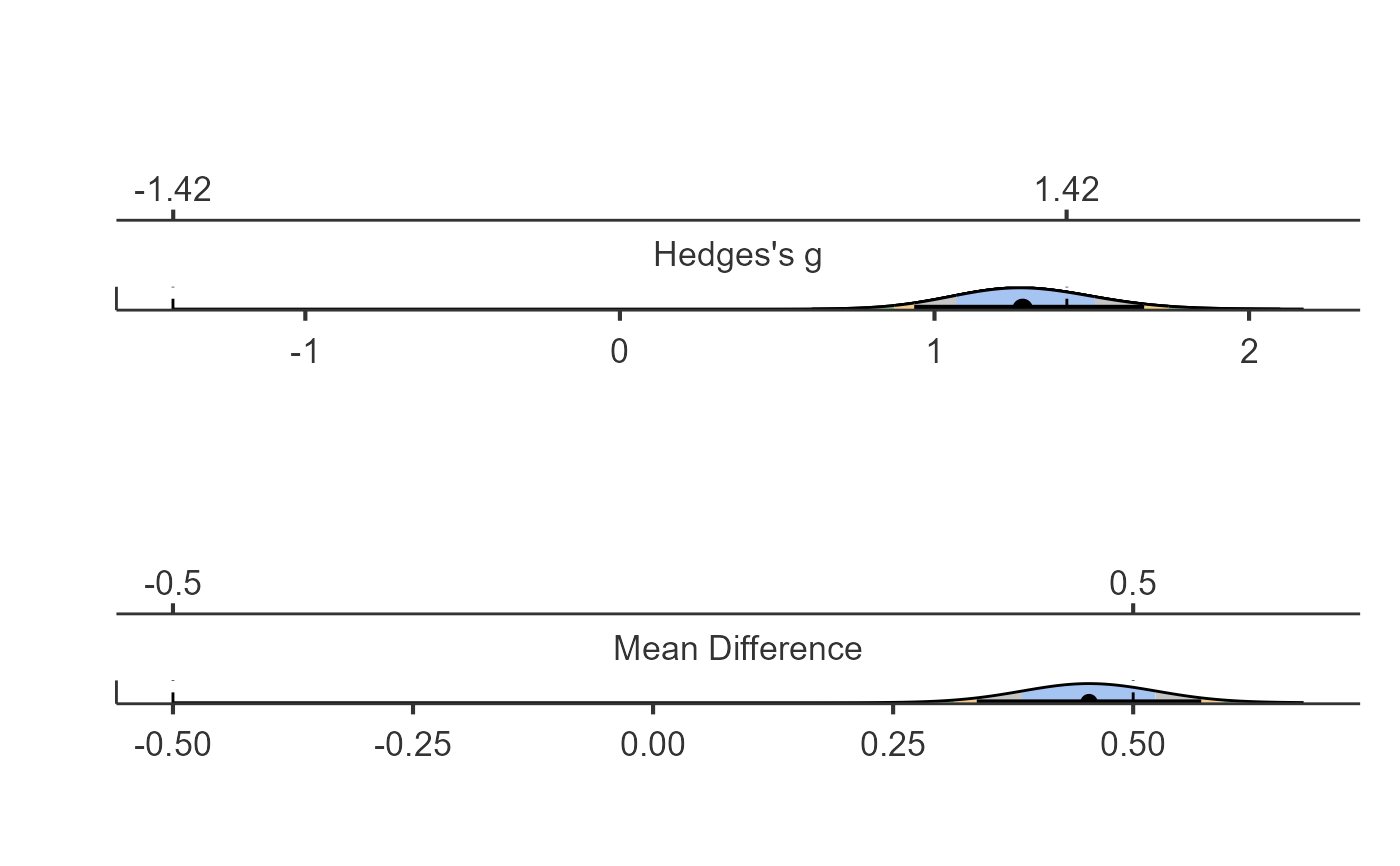
#> Sepal.Width Hedges's g -1.420782 1.420782
#> Raw -0.5000000 0.5000000
#> ────────────────────────────────────────────────────────
#>
#>
#> Effect Sizes
#> ────────────────────────────────────────────────────────────────────
#> Estimate Lower Upper
#> ────────────────────────────────────────────────────────────────────
#> Sepal.Width Hedges's g 1.280167 0.9356088 1.666477
#> Raw 0.4540000 0.3371241 0.5708759
#> ────────────────────────────────────────────────────────────────────
#> Note. Denominator set to the pooled SD
#>
#>
#> Descriptives
#> ────────────────────────────────────────────────────────────────────
#> N Mean Median SD SE
#> ────────────────────────────────────────────────────────────────────
#> Group 1 50 3.428000 3.400000 0.3790644 0.05360780
#> Group 2 50 2.974000 3.000000 0.3224966 0.04560791
#> ────────────────────────────────────────────────────────────────────
#>