TOST Paired Samples T-Test
dataTOSTpaired.RdTOST Paired Samples T-Test in jamovi. This function is not meant to be utilized in R. See t_TOST function.
Usage
dataTOSTpaired(
  data,
  pair1,
  pair2,
  hypothesis = "EQU",
  low_eqbound = -0.5,
  high_eqbound = 0.5,
  eqbound_type = "raw",
  alpha = 0.05,
  desc = FALSE,
  plots = FALSE,
  low_eqbound_dz = -999999999,
  high_eqbound_dz = -999999999,
  indplot = FALSE,
  diffplot = FALSE,
  smd_type = "g"
)
Arguments
- data
the data as a data frame
- pair1
A string naming the first part of the pair
- pair2
A string naming the second part of the pair
- hypothesis
'EQU'for equivalence (default), or'MET'for minimal effects test, the alternative hypothesis.- low_eqbound
a number (default: 0.5) the lower equivalence bounds
- high_eqbound
a number (default: 0.5) the upper equivalence bounds
- eqbound_type
'SMD'(default) or'raw'; whether the bounds are specified in standardized mean difference (Cohen's dz) or raw units respectively- alpha
alpha level (default = 0.05)
- desc
TRUEorFALSE(default), provide descriptive statistics- plots
TRUEorFALSE(default), provide plots- low_eqbound_dz
deprecated
- high_eqbound_dz
deprecated
- indplot
TRUEorFALSE(default), provide plot of paired data.- diffplot
TRUEorFALSE(default), provide plot of difference scores.- smd_type
'd'(default) or'g'; whether the calculated effect size is biased (d) or bias-corrected (g).
Value
A results object containing:
results$text | a html | ||||
results$tost | a table | ||||
results$eqb | a table | ||||
results$effsize | a table | ||||
results$desc | a table | ||||
results$plots | an image | ||||
results$indplot | an image | ||||
results$diffplot | an image |
Tables can be converted to data frames with asDF or as.data.frame. For example:
results$tost$asDF
as.data.frame(results$tost)
References
Mara, C. A., & Cribbie, R. A. (2012). Paired-Samples Tests of Equivalence. Communications in Statistics - Simulation and Computation, 41(10), 1928-1943. formula page 1932. Note there is a typo in the formula: n-1 should be n (personal communication, 31-08-2016)
Examples
# \donttest{
library("TOSTER")
dataTOSTpaired(data = randu, pair1 = "x", pair2="y", low_eqbound = -0.3,
high_eqbound = 0.3, alpha = 0.05, desc = TRUE, plots = TRUE)
#>
#> TOST PAIRED SAMPLES T-TEST
#>
#> Hypothesis Tested: Equivalence
#>
#> Null Hypothesis: -0.3 >= (Mean1 - Mean2) or (Mean1 - Mean2) >= 0.3
#> Alternative: -0.3 < (Mean1 - Mean2) < 0.3
#> ❌ NHST: don't reject null significance hypothesis that the
#> effect is equal to zero
#> ✅ TOST: reject null equivalence hypothesis
#>
#> Note: SMD confidence intervals are an approximation. See our <a
#> href="https://aaroncaldwell.us/TOSTERpkg/articles/SMD_calcs.html">documentation.
#>
#> TOST Results
#> ───────────────────────────────────────────────────────────
#> t df p
#> ───────────────────────────────────────────────────────────
#> x y t-test -1.926957 399 0.0546948
#> TOST Lower 12.390550 399 < .0000001
#> TOST Upper -16.244464 399 < .0000001
#> ───────────────────────────────────────────────────────────
#>
#>
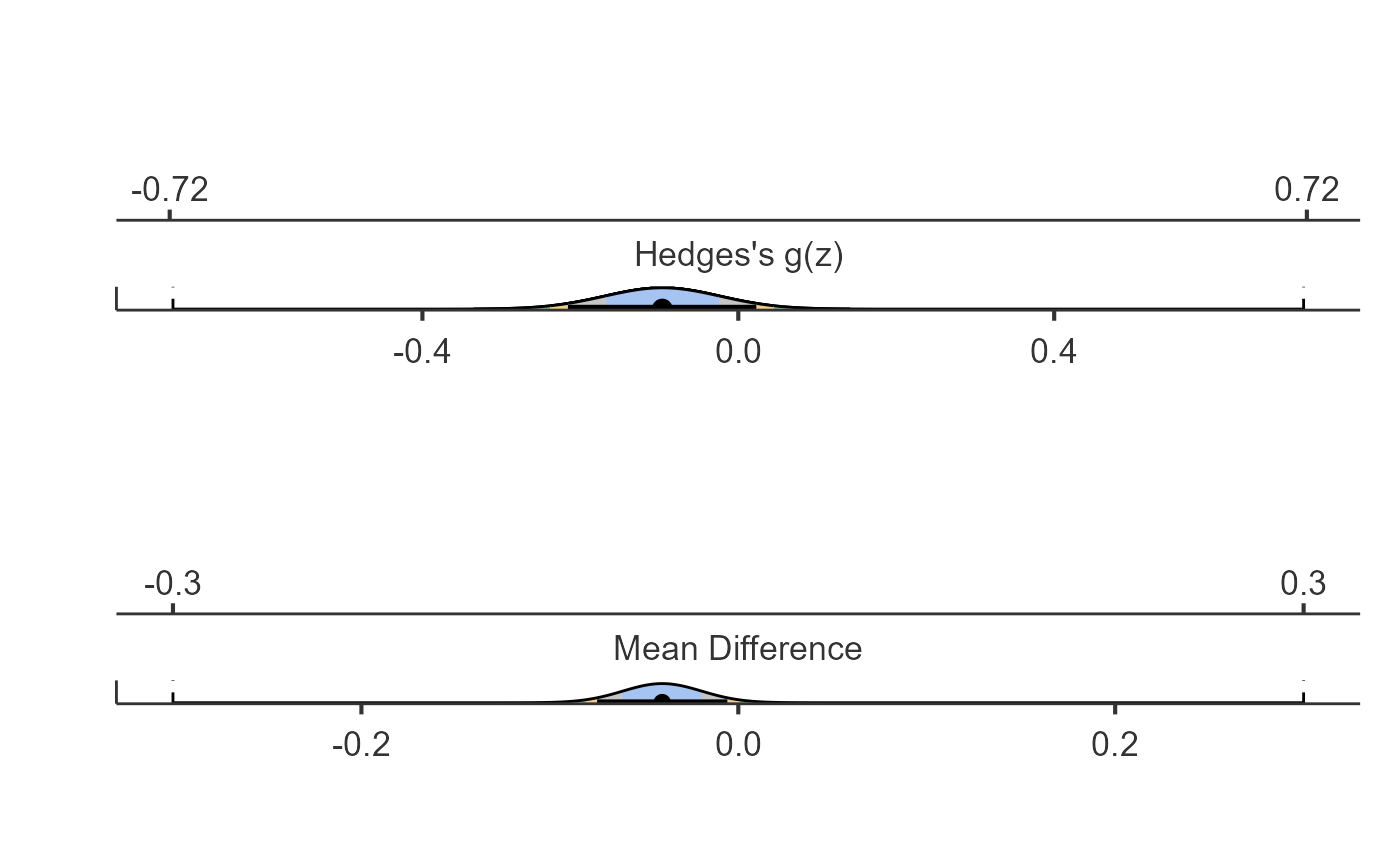
#> Equivalence Bounds
#> ────────────────────────────────────────────
#> Low High
#> ────────────────────────────────────────────
#> Hedges's g(z) -0.7158754 0.7158754
#> Raw -0.3000000 0.3000000
#> ────────────────────────────────────────────
#>
#>
#> Effect Sizes
#> ───────────────────────────────────────────────────────────────
#> Estimate Lower Upper
#> ───────────────────────────────────────────────────────────────
#> Raw -0.04037624 -0.07492167 -0.005830804
#> Hedges's g(z) -0.09625725 -0.21574952 0.022847794
#> ───────────────────────────────────────────────────────────────
#>
#>
#> Descriptives
#> ─────────────────────────────────────────────────────────────────
#> N Mean Median SD SE
#> ─────────────────────────────────────────────────────────────────
#> x 400 0.5264293 0.5407880 0.2850121 0.01425060
#> y 400 0.4860531 0.4833785 0.2937179 0.01468590
#> ─────────────────────────────────────────────────────────────────
#>
 # }
# }