What a control chart says about the University of Arkansas’s 2025 Clery numbers, and where to look for the cause
statistics
process control
Fayetteville
public safety
Author
Aaron R. Caldwell
Published
October 12, 2026
This post is about how institutions count and interpret reports of sexual violence. Every number below is a person. If you or someone you know needs support, RAINN’s hotline is 800-656-4673, and University of Arkansas students can reach the Sexual & Relationship Violence Center through the Pat Walker Health Center.
The headline
The University of Arkansas released its annual Clery report this month, and the local coverage led with a comparison:
Nineteen rape cases were reported in 2025 at the University of Arkansas, Fayetteville. The number is more than triple the six rape cases reported in 2024, and more than double the nine cases reported in 2023.
The math reported by the NWA Democrat-Gazette is correct. The framing however invites a question it cannot answer: is 19 a signal that something changed, or is it the kind of number this system produces from time to time?
Comparing one year to the year before cannot tell us, because the year before is itself a noisy draw. W. Edwards Deming spent much of his career warning managers about exactly this. Reacting to every rise and fall as if it had a specific cause, which he called tampering and demonstrated with his funnel experiment, makes systems worse (Deming 1986, 1994). Ignoring a genuine shift is the opposite mistake. A tool for helping tell the two apart is the control chart, invented by Walter Shewhart at Bell Labs and championed by Deming for the rest of his life (Shewhart 1931, 1939).
So let’s build a control chart to better understand the data.
What the number counts
As a statistician, I always want to be careful to understand the nature of the data I’m analyzing. So let’s define what a Clery Act “rape” count is, because most of the interpretive traps I’ve seen on social media live here.
It counts reports, not verified incidents. A Clery statistic records that a report was made to police or to a Campus Security Authority (a long list of university officials that includes the Title IX office, housing staff, coaches, and deans). It does not require an arrest, a charge, or a finding (U.S. Department of Education 2020).
It counts by the year reported. An assault from 2024 disclosed in 2025 is a 2025 statistic. This is not hypothetical: one of the residence hall reports filed in November 2025 concerned an incident from October 2024 (Wynn and Neuner 2025).
It counts by geography. The total combines on-campus property (including residence halls), noncampus property such as recognized fraternity and sorority houses, and adjacent public property. Assaults in private off-campus apartments, where many students live, are excluded entirely.
It is known to be a small fraction of what happens. The director of the campus Sexual & Relationship Violence Center has noted that the overwhelming majority of sexual assaults are never reported (Wynn and Neuner 2025).
A Clery count is therefore the output of two processes stacked on top of each other: the process that produces assaults, and the process that turns some of them into reports that reach a Campus Security Authority. A control chart cannot separate the two. It can tell us when the combined system behaved differently, which tells us where to start asking questions. We must then take care to know that 1) some events probably go unreported and 2) the process of reporting probably changes over time.
Are college campuses inherently problematic?
One concerning trend I see in the media, and in discussions with friends and colleagues, is that campuses are somehow uniquely dangerous (see, for example, coverage by NPR and Time, and the Columbia Journalism Review on how quickly that coverage grew). A rising count, and sensationalized media coverage, can invite that kind of conclusion. However, the national evidence runs counter to that conclusion. In the National Crime Victimization Survey, women aged 18 to 24 who were enrolled in college experienced rape and sexual assault at a somewhat lower rate than women the same age who were not (6 versus 8 per 1,000 per year). Unfortunately, it seems the risk of sexual assault appears to be concentrated in that age group rather than on college campuses (Sinozich and Langton 2014).
Frankly, that is cold comfort, and a quite depressing factoid. Early adulthood is among the highest-risk periods for women regardless of enrollment, the survey is known to undercount relative to public health surveys that ask more behaviorally specific questions, and roughly four in five student victimizations were never reported to police (Sinozich and Langton 2014). The relative comparison should be reassuring: college campuses are not uniquely dangerous. The absolute numbers are an indictment not of one campus, but of a culture that treats sexual assault as an ordinary hazard of young adulthood.
library(ggplot2)library(knitr)# data --------clery <-data.frame(year =2013:2025,rapes =c(6, 3, 7, 5, 9, 11, 11, 8, 19, 12, 9, 6, 19),enrollment =c(25300, 26301, 26770, 27194, 27558, 27778, 27559,27562, 29068, 30936, 32140, 33610, 34175),source =c(rep("News report", 6), rep("ASR table", 7)))# 2013 and 2015 enrollment are back-calculated from reported growth rates.# 2021-2023 sex offense counts were amended by the university after an# institutional review; values here are the amended figures.# ASR tables only, 2019-2025: rapes in residence halls (a subset of# on-campus) and fondling (all geography)asr <-data.frame(year =2019:2025,rape_total =c(11, 8, 19, 12, 9, 6, 19),rape_housing =c(9, 5, 16, 12, 8, 4, 16),fondling =c(5, 5, 10, 16, 6, 15, 7),# disciplinary referrals originating in residence hallsliquor_ref_housing =c(567, 340, 565, 606, 445, 347, 408),drug_ref_housing =c(15, 20, 57, 91, 75, 45, 131),# arrests and disciplinary referrals, all Clery geographyliquor_arrests =c(72, 35, 33, 30, 60, 120, 69),liquor_ref_all =c(587, 346, 584, 642, 478, 358, 441),drug_arrests =c(95, 57, 74, 58, 33, 43, 60),drug_ref_all =c(21, 25, 68, 110, 86, 65, 149))clery$rate <- clery$rapes / (clery$enrollment /1e4)kable(transform(clery[, c("year", "rapes", "enrollment", "rate", "source")],year =as.character(year)),col.names =c("Year", "Reported rapes", "Fall enrollment","Per 10,000 students", "Source"),digits =2,align =c("r", "r", "r", "r", "l"),format.args =list(big.mark =","))
Year
Reported rapes
Fall enrollment
Per 10,000 students
Source
2013
6
25,300
2.37
News report
2014
3
26,301
1.14
News report
2015
7
26,770
2.61
News report
2016
5
27,194
1.84
News report
2017
9
27,558
3.27
News report
2018
11
27,778
3.96
News report
2019
11
27,559
3.99
ASR table
2020
8
27,562
2.90
ASR table
2021
19
29,068
6.54
ASR table
2022
12
30,936
3.88
ASR table
2023
9
32,140
2.80
ASR table
2024
6
33,610
1.79
ASR table
2025
19
34,175
5.56
ASR table
The control chart
A count of rare, independent events over a fixed interval is well described by a Poisson distribution, whose variance equals its mean. That single property gives the c-chart its limits: the center line is the average count, and the upper control limit sits three standard deviations above it. Points beyond the limit are unlikely enough under a stable system that they warrant investigation (Montgomery 2019; Wheeler 2000).
One judgment call matters. If we compute limits from every year before 2025, 2021 inflates them, because 2021 also produced 19 reports and sits beyond the limits computed from the other years. Standard practice, which quality engineers call Phase I, is to identify points like that, set them aside, and compute limits from the years that look like a stable process (Montgomery 2019). That is what the chart below does; the appendix shows that the conclusion depends on this choice.
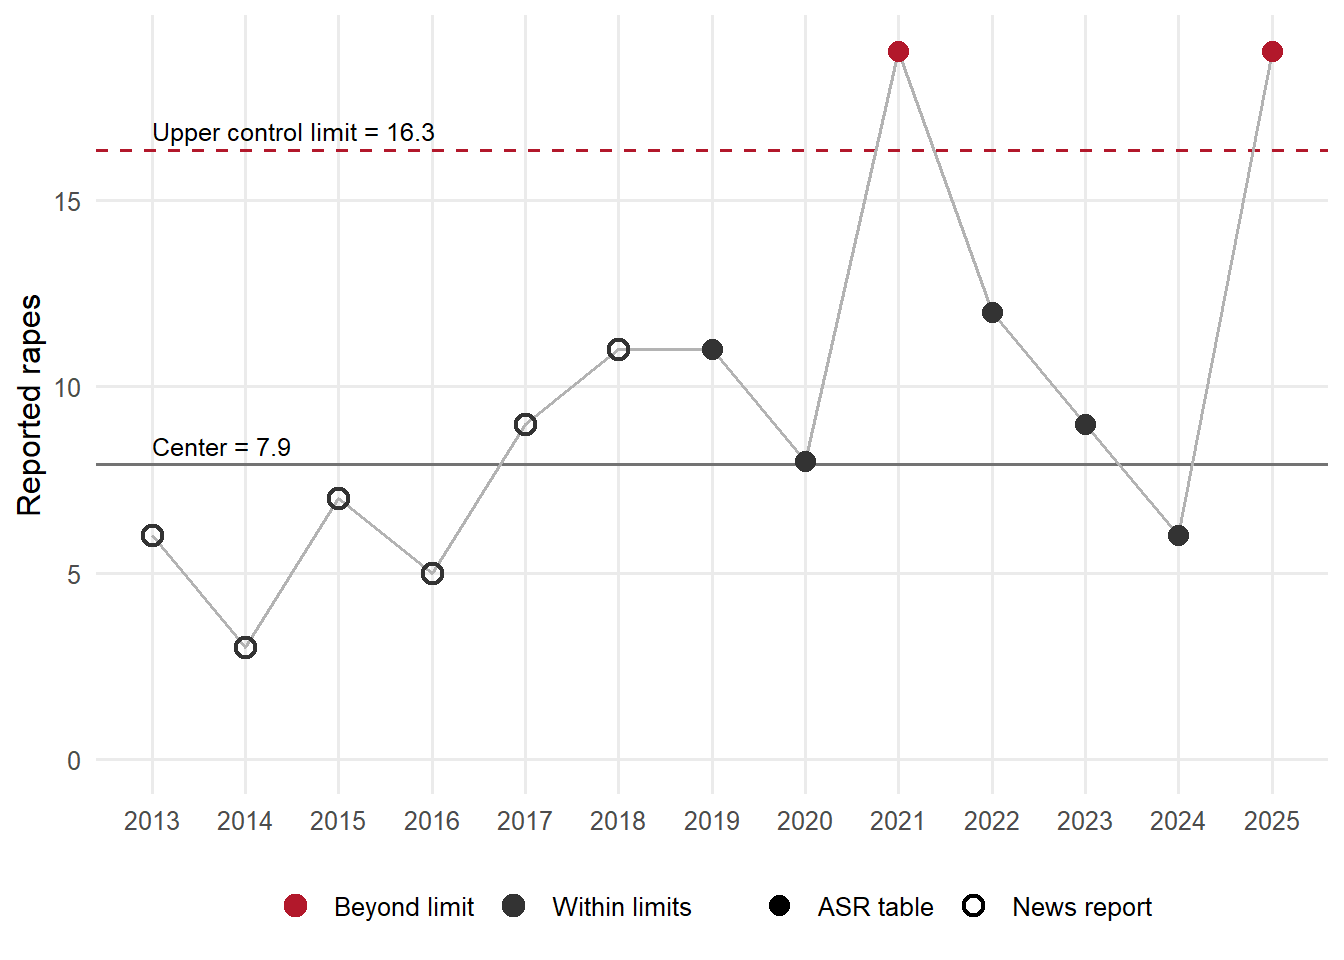
Figure 1: c-chart of Clery-reported rapes. Limits computed from 2013 to 2024 excluding 2021. Open points are from news coverage rather than the ASR tables.
The process averaged about 8 reports per year with an upper limit of about 16. Eleven of the thirteen years sit comfortably inside that band, including 2024’s 6, which the news framing treats as the reference point. Two years break out: 2021 and 2025, both at 19.
That reframes the headline. 2025 is not three times a normal year; 2024 was a low but ordinary year, and 2025 is the second time in five years the system has produced a count well outside its usual range.
Adjusting for a growing campus
The university is not the same size it was in 2013; complaints of student population growth in Fayetteville make that clear. Fall enrollment grew from roughly 25,000 to over 34,000, with most of that growth after 2020. More students means more opportunity for both assaults and reports, so a fair comparison should be per student. The u-chart does this: it plots the rate per 10,000 students, and its limits widen or narrow with each year’s enrollment.
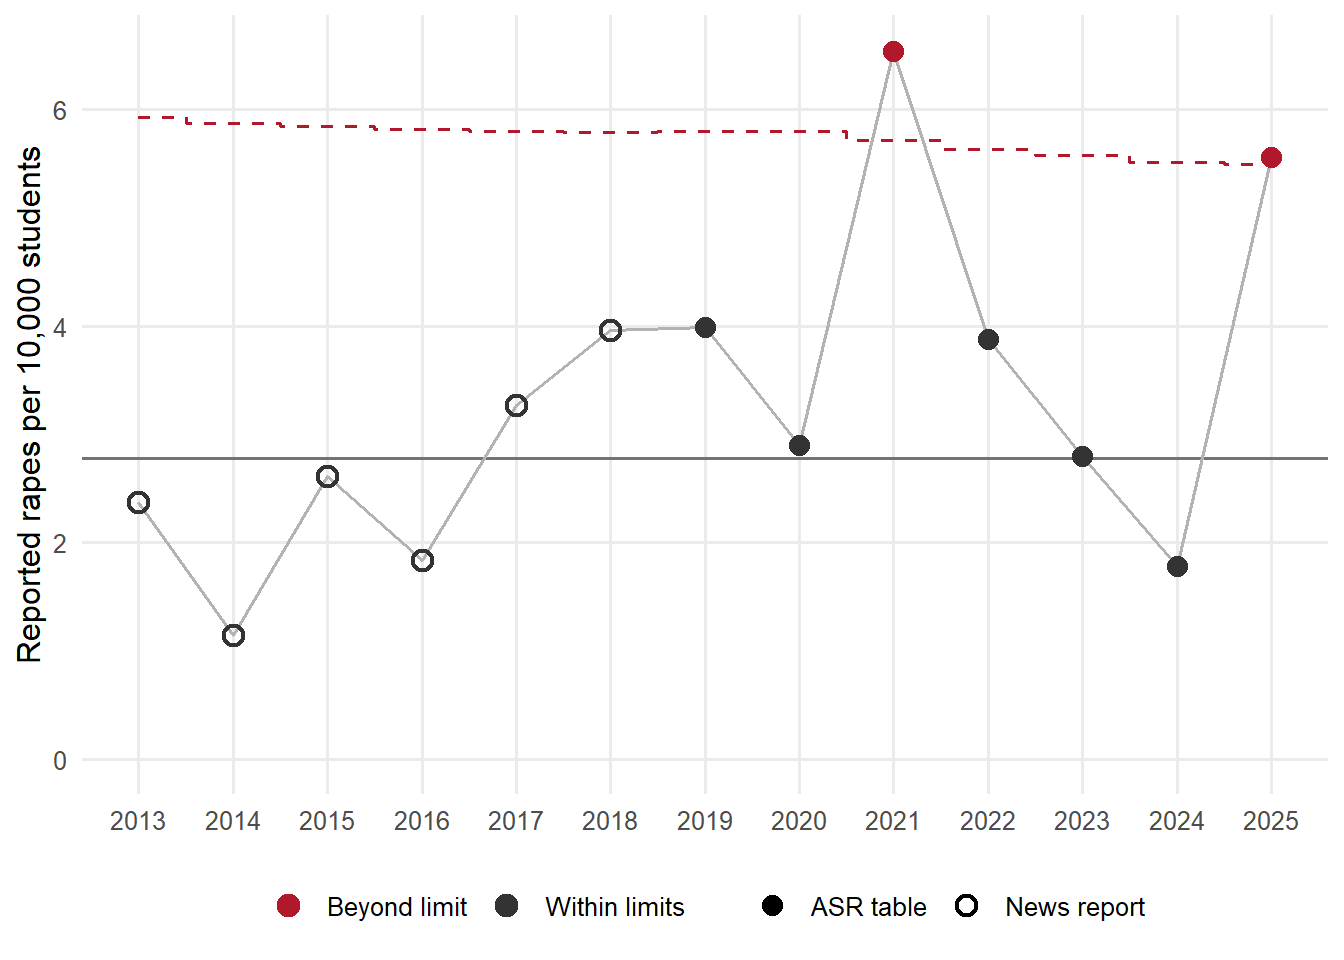
Figure 2: u-chart of reported rapes per 10,000 enrolled students. Limits computed from 2013 to 2024 excluding 2021.
Two things change. First, the apparent rise after 2020 largely disappears: the 2021 to 2024 rate is about 1.3 times the 2013 to 2020 rate, which is well within what chance and enrollment growth can produce. Second, 2025 becomes a much narrower signal. Its rate of 5.6 per 10,000 sits just above the upper limit of 5.5, while 2021, on a smaller campus, sits further out at 6.5. Enrollment growth explains very little of 2025 specifically, since the campus grew less than 2% from 2024.
The honest summary is that the reporting system has been stable at roughly 2.8 reports per 10,000 students per year, with two exceptions. Both deserve an explanation, and the explanation for one may illuminate the other.
Looking for the special cause
In Deming’s terms, common causes are built into a system: they produce its ordinary year-to-year variation and set its baseline level. Special causes are specific, identifiable events that push a point outside that range (Deming 1986). (This is different from the epidemiological sense of a “common cause” as a shared cause of two variables.) Deming’s instruction for a special cause is to find it rather than guess at it, and to look at the system before looking at people (Deming 1986). The first step is stratification: before asking why 2025 was different, ask where the difference lives. The Clery tables allow three relevant comparisons.
Where: almost entirely in residence halls
Clery reports a residence hall count as a subset of on-campus property. Splitting each year’s total into residence hall reports and everything else is revealing. The hall-level figures here are raw counts rather than rates: total enrollment is a poor denominator for residence hall exposure, because enrollment growth mostly spills into off-campus housing while hall capacity changes much more slowly.
Show code
# stratify by location --------strata <-rbind(data.frame(year = asr$year, n = asr$rape_housing, where ="Residence halls"),data.frame(year = asr$year, n = asr$rape_total - asr$rape_housing,where ="All other Clery geography"))ggplot(strata, aes(year, n, colour = where)) +geom_line() +geom_point(size =3) +scale_colour_manual(values =c(`Residence halls`="#b2182b",`All other Clery geography`="grey30")) +scale_x_continuous(breaks = asr$year) +scale_y_continuous(limits =c(0, NA)) +labs(x =NULL, y ="Reported rapes", colour =NULL) +theme_minimal(base_size =12) +theme(legend.position ="bottom", panel.grid.minor =element_blank())
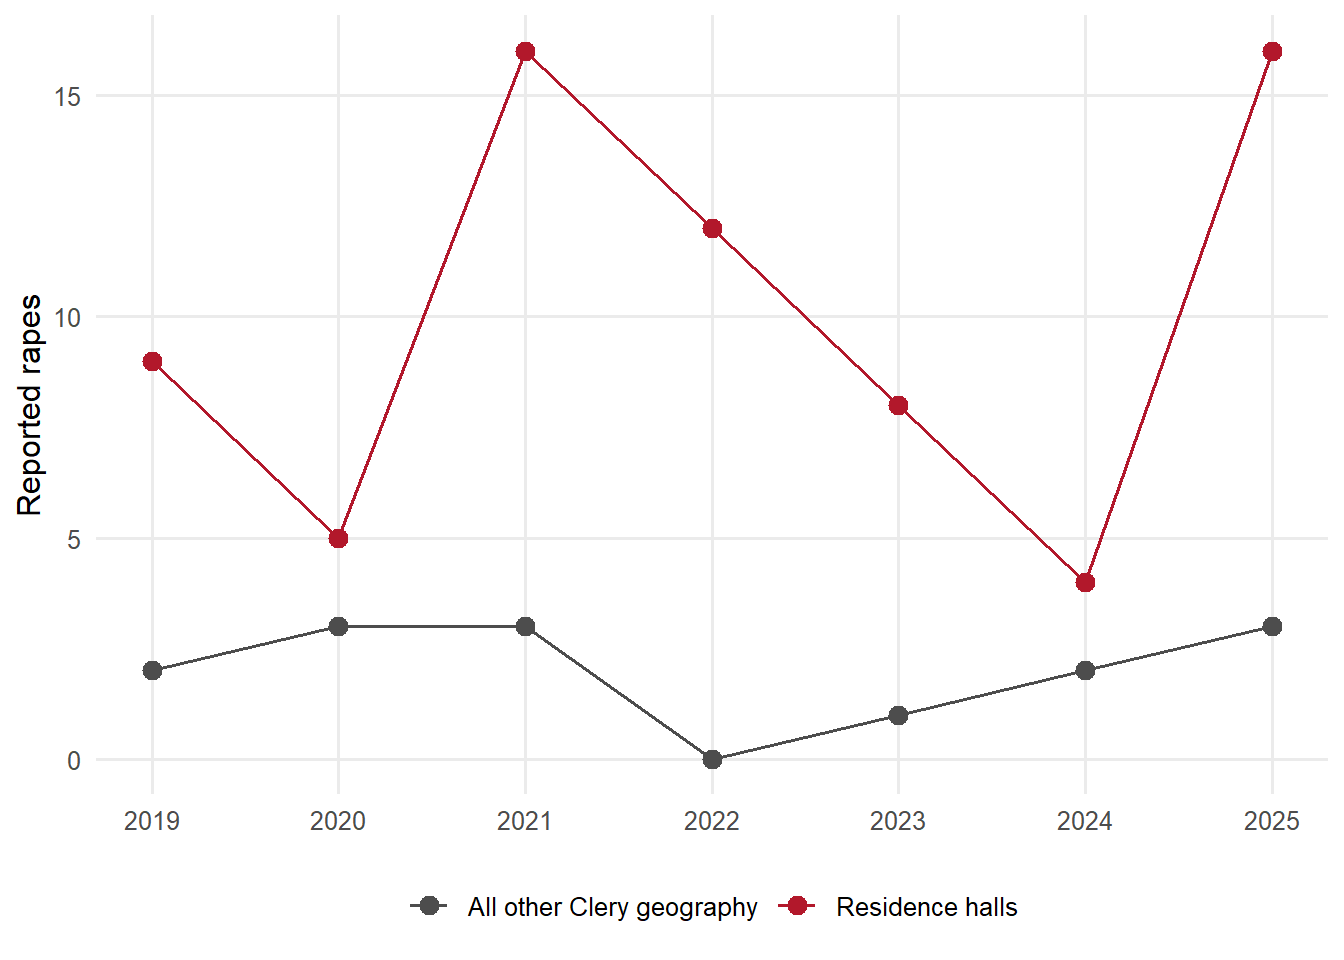
Figure 3: Reported rapes split into residence hall reports and all other Clery geography, 2019 to 2025 (ASR tables).
Reports from everywhere other than the residence halls have been flat at zero to three per year. Both spikes, 2021 and 2025, are residence hall spikes: 16 reports each year, against a typical 4 to 12. Whatever the special cause is, it operates in or through campus housing. That includes the halls themselves, but also housing staff, since resident assistants and hall directors are Campus Security Authorities who must pass along any disclosure they receive.
What: the broader category did not spike
Clery reports separate rape from fondling, and the line between them depends on the details of a report and on the judgment of whoever classifies it. Looking at the two together gives a different picture than rape alone.
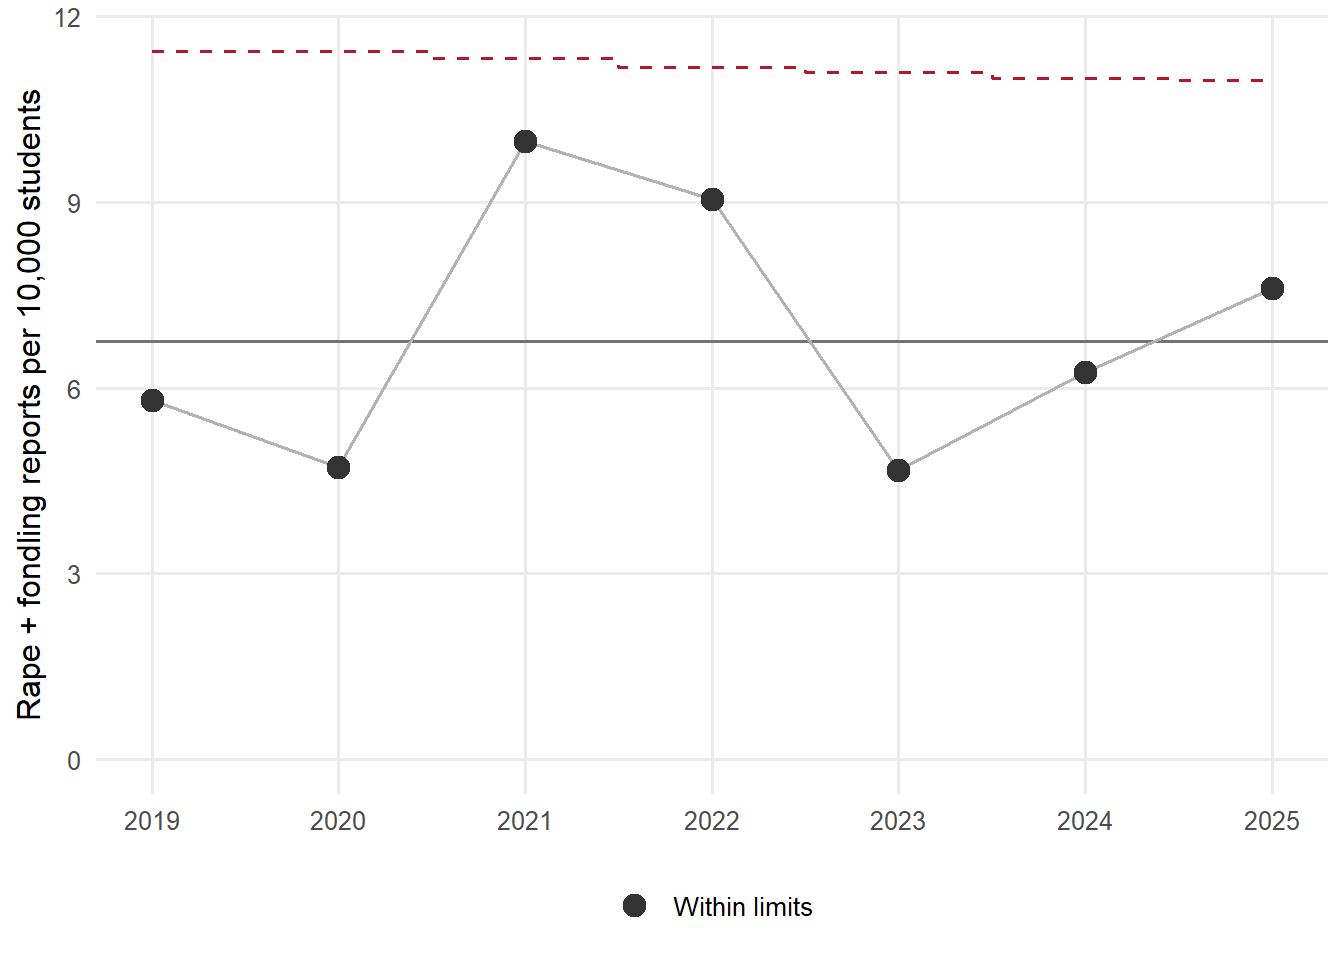
Figure 4: u-chart of rape and fondling reports combined, per 10,000 students. Limits computed from 2019 to 2024.
Fondling reports fell from 15 to 7 as rape reports rose from 6 to 19. The combined count of 26 is well within the 2019 to 2024 range of 13 to 29, and far below a control limit near 34. Adjusted for enrollment (Figure 4), no year from 2019 to 2025 breaks the limits, including 2021 and 2025, the two years that break out on rape alone: 2021 sits at 9.98 per 10,000 against a limit of 11.31, and 2025 at 7.61 against 10.96. Measured as rape and fondling together, 2025 is an ordinary year. That pattern fits a shift in classification, or in which reports reach the count, better than a change in total sexual violence. That does not mean the shift is merely clerical, since the mix of what survivors report can genuinely change, but it does mean the headline depends heavily on how rape and fondling line were categorized by the authorities.
When: many unrelated categories rose at once
The most Deming-like clue is outside the sex offense tables entirely.
Table 2: Selected Clery categories, all geography, from the 2025 ASR.
Category
2023
2024
2025
Rape
9
6
19
Stalking
15
20
39
Dating violence
8
7
13
Domestic violence
3
4
8
Burglary
12
6
21
Drug law disciplinary referrals
86
65
149
Liquor law arrests
60
120
69
Stalking, dating violence, domestic violence, burglary, and drug referrals all roughly doubled or more in 2025, while liquor law arrests fell back from an unusually high 2024 (see Table 4). When several measures that share little except the counting system move together in the same year, the first place to look is the counting system. The 2025 report itself was substantially restructured, partly to add hazing statistics under the new Stop Campus Hazing Act (University of Arkansas Police Department 2026). I do not know whether the way reports are solicited from Campus Security Authorities or compiled from external agencies also changed, but a change of that kind would produce this pattern.
Candidate causes
With the stratification in hand, the candidates can be ranked by how well they fit.
1. A change in how reports reach the count. This fits every clue. As of November 22, 2025, local reporting based on the university police crime log counted five rapes on campus for the year (Wynn 2025); the final Clery total was 19 (University of Arkansas Police Department 2026). Most of 2025’s reports did not come through the police log. They came through other Campus Security Authorities: the Title IX office, the Sexual & Relationship Violence Center, and housing staff. For 2021, the other out-of-control year, is a year whose count the university amended after an institutional review of its own records (University of Arkansas Police Department 2022). The count is demonstrably sensitive to how completely non-police reports are captured. A possible test of this theory would be to use the 2025 total by reporting source and month, compared with 2022 to 2024.
2. Delayed disclosures. Clery counts by date of report (U.S. Department of Education 2020), so a year can absorb disclosures of earlier assaults. One November 2025 residence hall report concerned an incident from October 2024 (Wynn and Neuner 2025). A possible test of this theory would be to use the distribution of incident dates behind the 2025 reports.
3. Classification between rape and fondling. Partly answered above: the combined count is unremarkable. A possible test of this theory would be to check whether classification guidance or the person responsible for classification changed in 2025.
4. Clustering. The control chart assumes independent events. One incident with several victims, or one offender or residence hall behind several reports, would produce a real but concentrated spike. A way to check this theory would be inspect the number of distinct incidents, offenders, and buildings behind the 16 residence hall reports.
5. Alcohol and drugs in the halls. This one is less a rival to the others than a possible thread running through them.1 Alcohol is the most consistent correlate of sexual assault among college students: at least half of such assaults involve drinking by the perpetrator, the victim, or both (Abbey 2002), and in a large multi-campus survey most assaults of college women followed voluntary drinking rather than covert drugging (Krebs et al. 2009). If substance abuse in the residence halls rose, more assaults, and more reports, would follow.
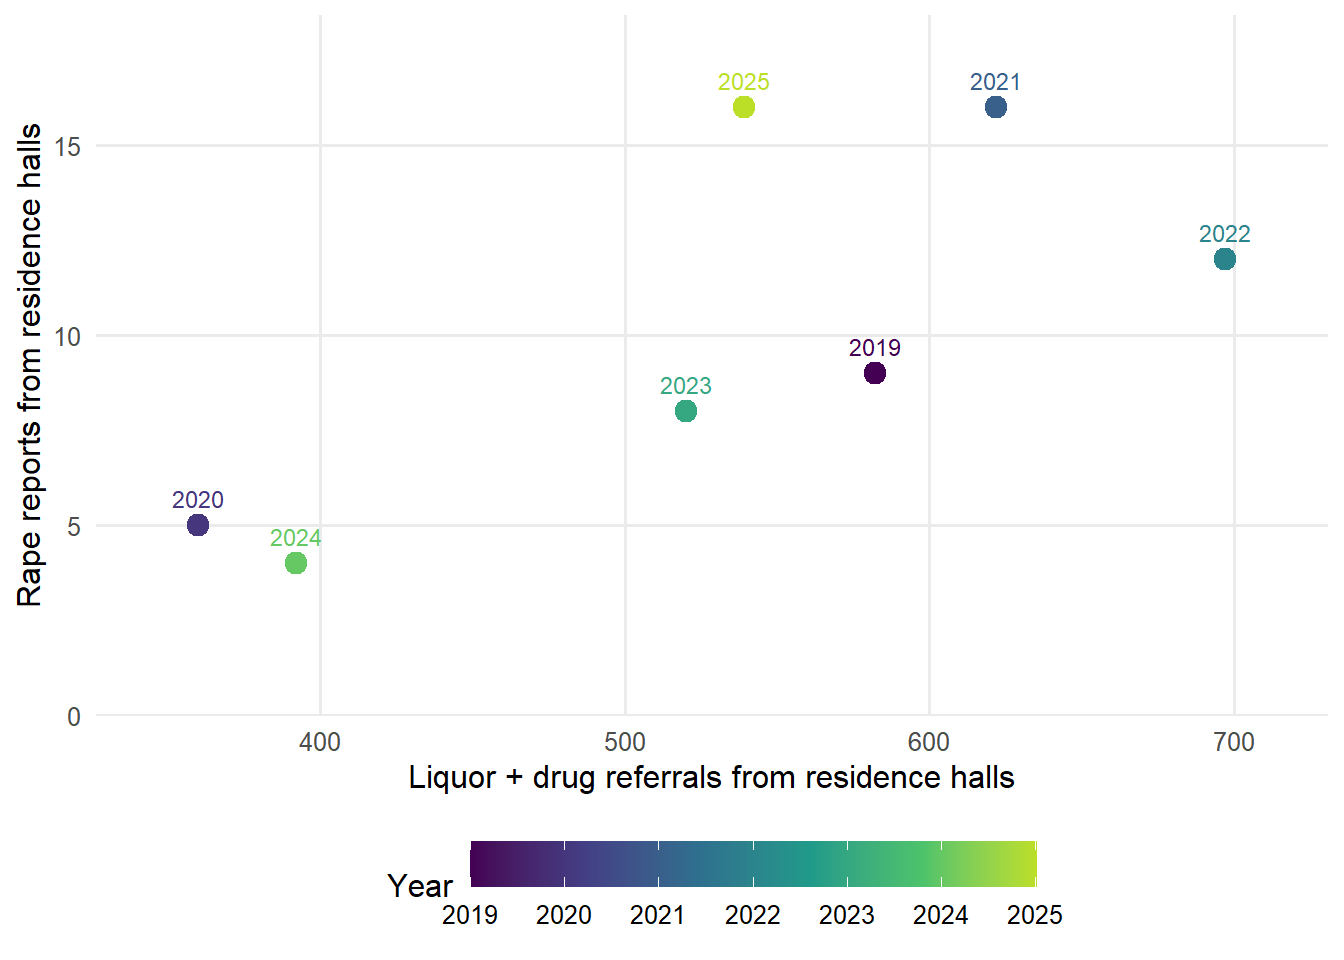
The Clery tables offer a rough way to look. Disciplinary referrals for liquor and drug violations are overwhelmingly generated in the residence halls, the same place the rape reports concentrate.
Figure 5: Residence hall rape reports against liquor and drug disciplinary referrals from the halls, 2019 to 2025.
The two move together loosely (Spearman’s ρ is about 0.76, though with seven points and a pandemic year that depresses everything, that is suggestive rather than persuasive).2 Drug referrals from the halls nearly tripled in 2025, the same year hall rape reports quadrupled. As with the location split, both axes are raw counts, since total enrollment says little about how many students live in the halls.
Table 4: Liquor and drug arrests (police) and disciplinary referrals (mostly housing staff), all Clery geography, from the ASR tables.
Year
Liquor arrests
Liquor referrals
Drug arrests
Drug referrals
2019
72
587
95
21
2020
35
346
57
25
2021
33
584
74
68
2022
30
642
58
110
2023
60
478
33
86
2024
120
358
43
65
2025
69
441
60
149
The caution is that referrals measure enforcement, not consumption, and they are written by the same housing staff who, as Campus Security Authorities, forward disclosures of assault. A more active housing staff would raise both numbers with no change in behavior. For liquor, 2024 was the unusual year: arrests doubled from 60 to 120, then returned to 69 in 2025, while liquor referrals rose from 358 to 441 over the same period (Table 4). Total liquor enforcement, arrests plus referrals, was roughly flat at 538, 478, and 510 for 2023 to 2025. Liquor enforcement shifted from police arrests toward housing referrals rather than declining, which matches the broader pattern in this post of police-generated counts falling while housing-generated counts rose. Measures that do not depend on enforcement would help: alcohol-related ambulance transports from the halls, medical amnesty calls, or campus survey data on heavy drinking.
Drugs look different. Unlike liquor, both drug channels rose in 2025: police arrests went from 43 to 60, and disciplinary referrals from 65 to 149. Two independent channels rising together is better evidence of more actual drug activity than one alone, though arrests remain within their historical range (33 to 95 since 2019) while referrals more than doubled. Rising use of particular drugs, such as ketamine, could be a new special cause layered on top of alcohol’s long-standing role. The Clery tables do not break referrals out by substance, so this is a hypothesis to test, not something I can dig into with the available data from the Clery reports.
Alcohol and drugs may matter less as an explanation for one bad year than as a standing feature of the system, a point I return to at the end.
6. Federal Title IX rules. The weakest candidate. There was a 2024 rule that was blocked in Arkansas by a federal court in July 2024, before it took effect (Arkansas Advocate 2024), and was vacated nationwide in January 2025 (Pullman & Comley 2025). The university operated under the 2020 framework throughout. It is unlikely that this changed anything barring new information.
7. A real increase in assaults. Nothing above rules this out, and a chart of reports cannot settle it. Independent measures can: campus climate survey results, sexual assault nurse examiner volumes at local hospitals, and caseloads at local sexual assault centers and advocacy organizations. If those moved with the Clery count, the case for a real change in harm becomes much stronger.
What to ask for
The useful response to this year’s number is neither alarm at “triple” nor reassurance that “it’s within normal variation.” It is a short list of questions for the university, each of which can confirm or eliminate a candidate cause:
How were the 19 reports received: through UAPD, the Title IX office, housing staff, or other Campus Security Authorities? How does that compare with 2022 to 2024?
What share of the 2025 reports describe incidents from earlier years?
How many distinct incidents and residence halls account for the 16 residence hall reports?
Did the process for collecting reports from Campus Security Authorities or classifying sex offenses change in 2025?
What did the 2021 to 2023 institutional review change, and what was the 2021 count before amendment?
Did alcohol-related medical transports or amnesty calls from the residence halls rise in 2025?
Which substances account for the rise in drug referrals from the residence halls in 2025?
Did total conduct referrals from housing staff, across all categories, rise in 2025? (If everything rose, staff activity is the likelier driver; if drug referrals rose alone, behavior is.)
Concluding Remarks
Overall, reported sexual assaults at the University of Arkansas have mostly varied within the system’s ordinary range. The two years that break out, 2021 and 2025, point more toward changes in how reports reach the count than toward changes in harm. This is why reading public data like the Clery report should be done with a statistician’s mindset: without the limits, every rise looks like a crisis and every fall looks like progress.
However, this analysis does not absolve anyone of responsibility. Deming argued that most of the variation in any system belongs to the system (Deming 1986), and that the job of management is to improve the system rather than react to its outputs. For a university reading its Clery numbers, that translates into two obligations.
First, do not tamper. A count that sits within its limits is noise. Treating noise as news, whether as alarm when it rises or as credit when it falls, has an unfortunate side effect: it invites changes that make the system worse. Even a genuine signal like 2025’s is first a question about the reporting process, not an indictment of campus safety at the University of Arkansas. A better reporting system will, for a while, produce larger numbers. Goodhart’s law warns that when a measure becomes a target, it ceases to be a good measure. My fear, then, is a university that responds to 19 by making disclosure harder: it would improve its statistics and fail its students.
From my perspective, the safeguard is a secondary measure that does not pass through the reporting process. A campus climate survey asks a random sample of students directly about victimization, and about whether they told anyone.3 Those two questions separate what the Clery count blends together: how often harm occurs, and how often it is reported. Run regularly with consistent questions, such a survey shows whether harm is changing without depending on how many reports reach a Campus Security Authority4. Heavy drinking and drug use, which the Clery tables reveal only through enforcement counts, could be tracked as behavior that would be informative for campus policy. Read alongside the Clery count, it would show not only whether the system is changing, but why.
Second, attack the common causes. The baseline itself is a real, persistent problem. I don’t find it acceptable that there are nearly three reported rapes per 10,000 students in an ordinary year (mainly in campus housing no less!), and several times that in assaults never reported. No response to a single year will move it. Heavy drinking and drug use are among its largest common causes. Blackout-level intoxication, whether from alcohol or other drugs, impairs everyone in the room. It erodes the conditions under which consent can be given or reliably read, and it gives cover to people who exploit impairment (Abbey 2002). Responsibility for an assault rests with the person who commits it. But a campus culture that normalizes and encourages substance abuse will produce more of those situations, and reducing it is one of the few levers that could lower the whole process rather than one bad year.
Campus administrators should be mindful that how substance abuse is targeted matters. Campus alcohol bans are associated with fewer heavy drinkers overall, but drinkers at these schools drink to extremes as often, and experience as many alcohol-related problems, as drinkers elsewhere (Wechsler et al. 2001). Prohibition can shrink the number of drinkers while displacing heavy drinking into private, faster, less visible settings. Levers aimed at the factors influencing binge behavior itself seem most effective (National Institute on Alcohol Abuse and Alcoholism 2019; Kypri et al. 2011). Unfortunately for campus administrators, many of these levers sit with the city and the state authorities for alcohol regulation not the university. The common cause of alcohol crosses into shared responsibility of everyone who owns part of the system. While personally I feel that alcohol is very much a causal factor, the evidence is not considered settled (Lippy and DeGue 2016).
Substance abuse is not the only common cause a campus administration can target. Peer norms that tolerate sexual aggression can be addressed through bystander intervention (Coker et al. 2016). Perpetration risk can be addressed directly through programs aimed at men’s attitudes and behavior, such as RealConsent, which reduced self-reported perpetration in a randomized trial (Salazar et al. 2014). The system can also give students tools to protect themselves. In a randomized trial, a resistance program for university women, teaching risk assessment and self-defense skills, nearly halved the one-year risk of completed rape (5.2% vs 9.8%) (Senn et al. 2015).5. The evidence for most of these programs is modest, drawn largely from self-reported outcomes and few independent replications; the randomized trial of the resistance program is the strongest exception. The CDC’s sexual violence prevention technical package, originally released as STOP SV, collects these approaches in one place (Basile et al. 2016).
Finally, the system should be judged by the right measure. A campus reporting fewer assaults is not necessarily safer, and one reporting more may simply be hearing about more of them. When the Department of Education audited universities for Clery compliance, their reported sexual assaults rose by about 44% during the audits (Yung 2015). Improving prevention and improving reporting can push the count in opposite directions for a while, which is why leadership should judge the system by its efforts and by survey-measured victimization, not by the mandated Clery count alone.
Technical appendix
Sensitivity to the baseline
The conclusion depends on how the baseline is defined. The table compares three choices.
Table 5: Control limits and tail probabilities for 2025 (19 reports) under three baselines.
Baseline
Years
Center
UCL (3σ)
Var/mean
P (Poisson)
P (neg. binomial)
P (conditional)
2013-2024
12
8.83
17.75
1.97
0.0020
0.0231
0.0033
2013-2024 excl. 2021
11
7.91
16.35
1.00
0.0006
NA
0.0012
2021-2024
4
11.50
21.67
2.70
0.0262
0.1109
0.0486
Excluding 2021, the baseline is close to Poisson (variance to mean ratio near 1) and 2025 is a clear signal. Including 2021, the variance roughly doubles; a negative binomial model with that dispersion places the upper limit near 25, and 2025 is no longer unusual. Using only 2021 to 2024 as the baseline, which assumes the amended-reporting era is a new process, gives a limit near 22. Which baseline is right is not a statistical question. It depends on whether 2021 reflects the same special cause as 2025, which is exactly what the data requests above would answer.
The “conditional” column uses a test that does not treat the baseline mean as known: given the total count across baseline and test years, under equal rates the test-year count is binomial with probability 1/(k+1). It is more conservative than the Poisson tail probability, which ignores uncertainty in the estimated center line.
    Comparison of Poisson rates

data:  c(sum(clery$rapes[post]), sum(clery$rapes[pre])) time base: c(sum(n_k[post]), sum(n_k[pre]))
count1 = 46, expected count1 = 39.002, p-value = 0.1599
alternative hypothesis: true rate ratio is not equal to 1
95 percent confidence interval:
 0.8769687 1.9663958
sample estimates:
rate ratio
  1.316991
On raw counts, the 2021 to 2024 mean (11.5) is noticeably above 2013 to 2020 (7.5). Per student, the rate ratio is about 1.3 and is compatible with no change.
Combined sex offenses
Show code
# dispersion of the combined baseline --------so_disp <-var(so$combined[so_base]) /mean(so$combined[so_base])so_disp
[1] 2.314754
The 2019 to 2024 combined rape and fondling baseline has a variance-to-mean ratio of about 2.3, so the Poisson-based limits in Figure 4 are, if anything, too narrow. The finding that no year breaks out is therefore conservative.
Limitations
The 2013 to 2018 counts are from news coverage, and 2016 may not include all Clery geography. Enrollment for 2013 and 2015 is back-calculated from reported growth rates. Enrollment is a crude exposure measure; on-campus residential population would be better for the residence hall share of reports. Thirteen annual points is a short series for setting control limits, and the limits themselves are estimates. Finally, the stratification by location, category, and year, and the candidate causes that follow from it, were explored after seeing the data. With so few annual points and many possible cuts, they are exploratory. These should allow leadership to ask the right questions, not be settled truth. The seven-point correlation between residence hall referrals and rape reports is the clearest example of a pattern to treat as a lead rather than a definitive causal pathway.
Disclosures
Claude Opus 5.5 (Anthropic) was utilized to help generate this report. Specifically, it was used for:
writing and checking the R code,
editing text based on my instructions,
checking the numbers in the prose against the computed output, and
verifying references against Crossref, PubMed, and the source papers.
I stand by the findings. However, I am a statistician, and I do not consider myself an expert in campus sexual violence, its prevention, or Clery Act compliance.
Coker, Ann L., Heather M. Bush, Bonnie S. Fisher, et al. 2016. “Multi-College Bystander Intervention Evaluation for Violence Prevention.”American Journal of Preventive Medicine 50 (3): 295–302. https://doi.org/10.1016/j.amepre.2015.08.034.
Deming, W. Edwards. 1986. Out of the Crisis. MIT Center for Advanced Engineering Study.
Deming, W. Edwards. 1994. The New Economics for Industry, Government, Education. 2nd ed. MIT Press.
Hepola, Sarah. 2015. Blackout: Remembering the Things i Drank to Forget. Grand Central Publishing.
Krebs, Christopher P., Christine H. Lindquist, Tara D. Warner, Bonnie S. Fisher, and Sandra L. Martin. 2009. “College Women’s Experiences with Physically Forced, Alcohol- or Other Drug-Enabled, and Drug-Facilitated Sexual Assault Before and Since Entering College.”Journal of American College Health 57 (6): 639–49. https://doi.org/10.3200/JACH.57.6.639-649.
Kypri, Kypros, Craig Jones, Patrick McElduff, and Daniel Barker. 2011. “Effects of Restricting Pub Closing Times on Night-Time Assaults in an Australian City.”Addiction 106 (2): 303–10. https://doi.org/10.1111/j.1360-0443.2010.03125.x.
Lippy, Caroline, and Sarah DeGue. 2016. “Exploring Alcohol Policy Approaches to Prevent Sexual Violence Perpetration.”Trauma, Violence, & Abuse 17 (1): 26–42. https://doi.org/10.1177/1524838014557291.
Montgomery, Douglas C. 2019. Introduction to Statistical Quality Control. 8th ed. Wiley.
Pearson, Karl. 1897. “Mathematical Contributions to the Theory of Evolution: On a Form of Spurious Correlation Which May Arise When Indices Are Used in the Measurement of Organs.”Proceedings of the Royal Society of London 60: 489–98. https://doi.org/10.1098/rspl.1896.0076.
Salazar, Laura F., Alana Vivolo-Kantor, James Hardin, and Alan Berkowitz. 2014. “A Web-Based Sexual Violence Bystander Intervention for Male College Students: Randomized Controlled Trial.”Journal of Medical Internet Research 16 (9): e203. https://doi.org/10.2196/jmir.3426.
Senn, Charlene Y., Misha Eliasziw, Paula C. Barata, et al. 2015. “Efficacy of a Sexual Assault Resistance Program for University Women.”New England Journal of Medicine 372 (24): 2326–35. https://doi.org/10.1056/NEJMsa1411131.
Shewhart, Walter A. 1931. Economic Control of Quality of Manufactured Product. D. Van Nostrand.
Shewhart, Walter A. 1939. Statistical Method from the Viewpoint of Quality Control. Edited by W. Edwards Deming. Graduate School of the Department of Agriculture.
Wechsler, H., J. E. Lee, J. Gledhill-Hoyt, and T. F. Nelson. 2001. “Alcohol Use and Problems at Colleges Banning Alcohol: Results of a National Survey.”Journal of Studies on Alcohol 62 (2): 133–41. https://doi.org/10.15288/jsa.2001.62.133.
Wheeler, Donald J. 2000. Understanding Variation: The Key to Managing Chaos. 2nd ed. SPC Press.
Wynn, Reagan, and Dylan Neuner. 2025. “2 Dorm Sexual Assault Cases Under Investigation at UofA; 2025 Reports Almost Equal 2024.” KNWA/FOX24, November 13. https://digital-release.nwahomepage.com/?p=2447590.
Yung, Corey Rayburn. 2015. “Concealing Campus Sexual Assault: An Empirical Examination.”Psychology, Public Policy, and Law 21 (1): 1–9. https://doi.org/10.1037/law0000037.
Footnotes
This line of thinking was prompted by Sarah Hepola’s memoir Blackout: Remembering the Things I Drank to Forget(Hepola 2015), whose account of drinking to the point of memory loss captures, from the inside, how alcohol can blur the edges of consent and memory alike and lead to an increase in tragic situations that lead to sexual assault.↩︎
The scatter uses raw counts on purpose. Dividing two counts by a common, trending denominator can induce correlation between them even when they are unrelated, a problem first described by Pearson (1897). Here it makes little difference: normalizing both axes by enrollment changes Spearman’s ρ from 0.76 to 0.71 and Pearson’s r from 0.73 to 0.72, because the referral counts vary far more than enrollment does.↩︎
The word random carries much of the weight here, and the argument assumes a well-designed survey. Institutions should invest the time and money needed to make these data accurate; a convenience sample, or a survey with a low response rate, can mislead as badly as the Clery count.↩︎
The survey must itself be validated before it is trusted. A poorly executed and developed survey would be worse than not having one at all↩︎
This is not a shift of responsibility onto potential victims. Responsibility for an assault rests with the person who commits it. The point is that offering such a program is something the institution can choose to do, and it gives students a better chance of defending themselves.↩︎