Justify your alpha level by minimizing or balancing Type 1 and Type 2 error rates.
Source:R/minimize_balance_alpha.R
optimal_alpha.RdJustify your alpha level by minimizing or balancing Type 1 and Type 2 error rates.
optimal_alpha(
  power_function,
  costT1T2 = 1,
  priorH1H0 = 1,
  error = c("minimal", "balance"),
  plot = Superpower_options("plot")
)
Arguments
- power_function
Function that outputs the power, calculated with an analytic function.
- costT1T2
Relative cost of Type 1 errors vs. Type 2 errors.
- priorH1H0
How much more likely a-priori is H1 than H0?
- error
Either "minimal" to minimize error rates, or "balance" to balance error rate
- plot
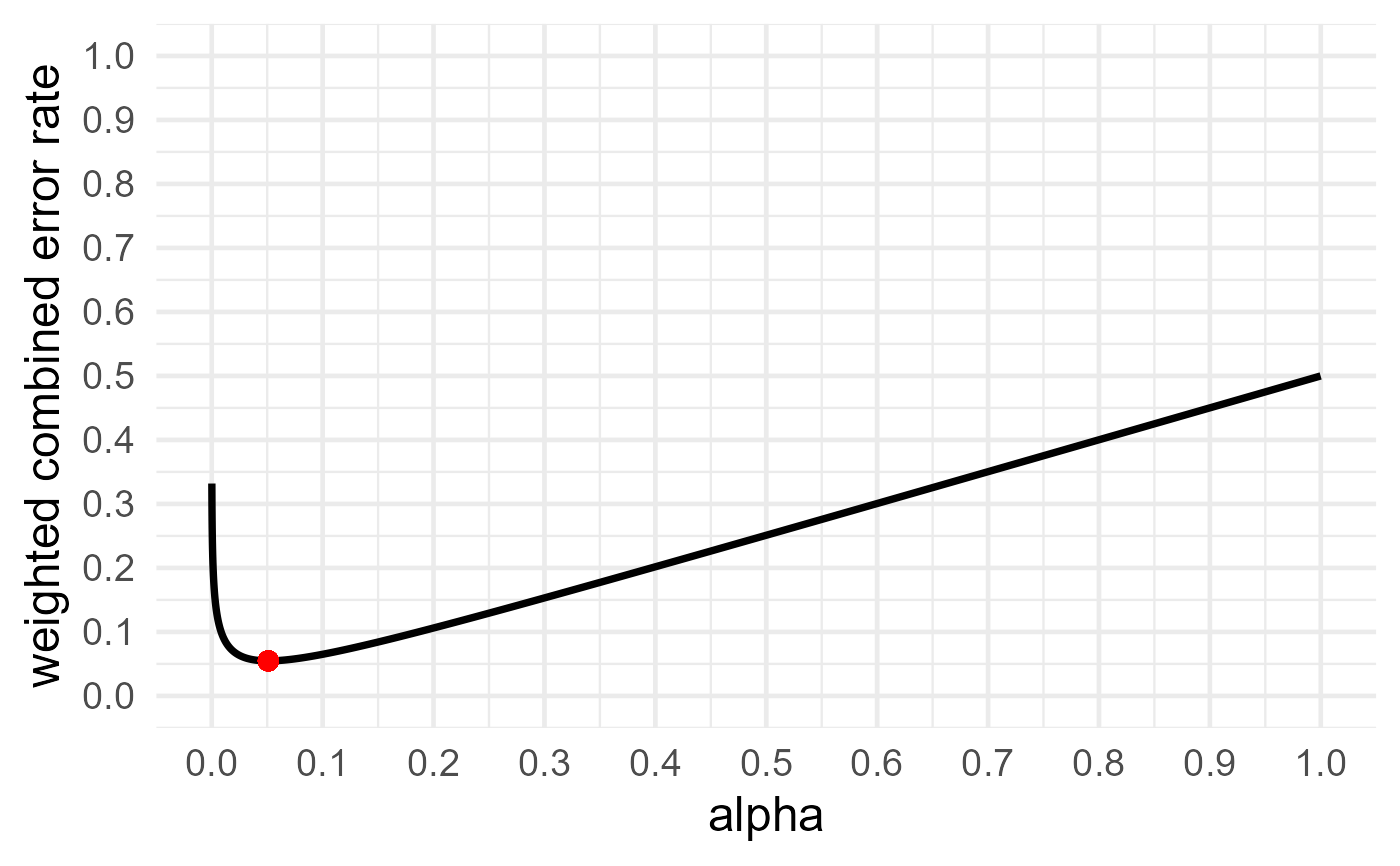
When set to TRUE, automatically outputs a plot of alpha (x-axis) and beta (y-axis) error rates
Value
alpha = alpha or Type 1 error that minimizes or balances combined error rates beta = beta or Type 2 error that minimizes or balances combined error rates objective = value that is the result of the minimization, either 0 (for balance) or the combined weighted error rates plot =
References
too be added
Examples
## Optimize power for a independent t-test, smallest effect of interest
## d = 0.5, 100 participants per condition
res <- optimal_alpha(power_function = "pwr::pwr.t.test(d = 0.5, n = 100,
sig.level = x, type = 'two.sample', alternative = 'two.sided')$power")
#> Warning: All aesthetics have length 1, but the data has 9999 rows.
#> ℹ Please consider using `annotate()` or provide this layer with data containing
#>   a single row.

res$alpha
#> [1] 0.05101728
res$beta
#> [1] 0.05853977